Sports Science: How Coaches Can Use it to Enhance Performance
Coaches can use sports science to be more effective when training athletes. Sports science is about applying scientific principles to yield more significant results (in this case, enhance an athlete's performance), mentally and physically.
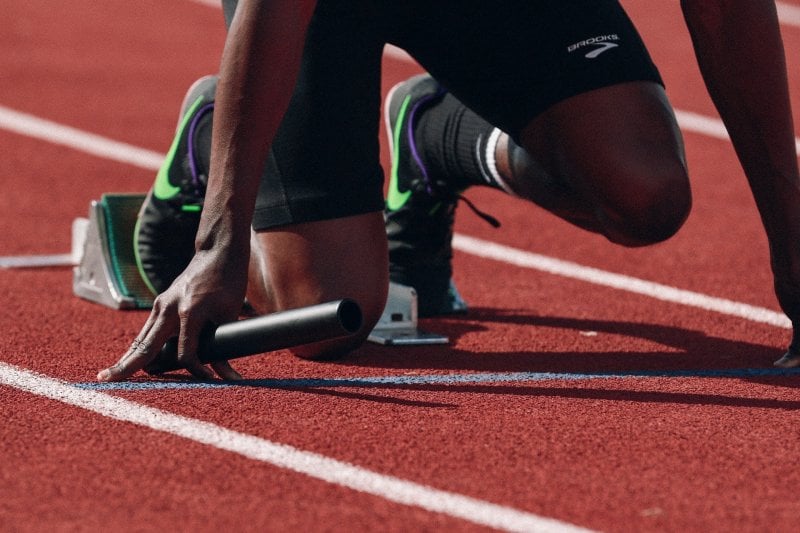
Biomechanics, for example, is a field of science that deals with movement. And therefore, by using their knowledge of biomechanics, coaches can analyze how an ideal top performer moves.
Notably, one of the fastest athletes in the world is Usain Bolt. And according to an official IAAF report (based on the 2009 World Championships performance data), he can run 100m in 9.58 seconds.
Enhance Your Performance as an Athlete Mentally
26 Aug 2021
Athletes are results-driven winners by nature, compelled to push the limits in everything they do. That’s the job, really. You strive and reach for the stars, grappling with the edges of your ability until you break through to the top of the field or fall in the attempt.
Like the gambler playing his online slots, or the chess master plotting many moves ahead, the athlete must run against the pack. Indeed the athlete must run against themselves above all.
The best version of you
Any sports psychologist will tell you, once you get to the pinnacle of any sporting prowess, the margins are negligible. So little separates athletes at this level that they can almost be a single person.
What makes the difference, then? Well, it’s in the mind. The only thing which differentiates a very good athlete from an outright champion is mental resilience and strength. To be the very best version of yourself, you have to combat mental weakness.
A really good bit of advice is to parcel things into manageable chunks and to take things as they come. Remain calm even under pressure, remembering your key informational parcels, and work within that framework without fail.
As you train, visualize your task in these smaller pieces, giving them short and emotive titles that are easy to remember and summon up when you need them. These will be personal to you but could include strong directives like push, go, up, force, or others.
It may seem a little silly or funny initially, but once you get the hang of attaching these short commands to aspects of your performance, you may start seeing results fairly quickly. The results never lie.
Another thing to keep in mind is that while there are other competitors out there with you, it’s really your own inner reality that matters most. Be keenly aware of your thoughts, and manage them by overcoming them daily as you train.
Taken to the psychological limits
Focus is key here. You can’t attain what you desire until you have a very clear and simple understanding of what that desire is and a step-by-step plan of how to get there. Clarity and focus are the athlete’s ally, more than equipment or training.
If it’s clear to you what you’re doing and why you’re doing it, then you’re twice the athlete you would’ve been already. You’re already ahead of that lesser self and on your way to harnessing your full potential.
Clarity of purpose, the focus and determination to do what’s required, and the strategic use of planning are the tools every athlete needs in whatever area of competition you’re engaging. Winning is winning, and the particular discipline almost doesn’t matter.
Once you start putting these seemingly little tricks into place, you will begin to see the difference in your stats. You may not ultimately become some great Olympic medallist, but you will certainly have outpaced and outclassed your prior self.
Studying Dehydration in Athletes
28 Jul 2021
When it comes to sports science, one area that always requires further investigation is the athlete's performance during their event. A significant concern is dehydration and its effects. Sports scientists can undertake valuable research to try and discover the optimum hydration level of a sports person.
Sports Science as a Career
16 Jun 2021
Sports science can be a lucrative and rewarding career, and obtaining a degree in this subject can lead to many different avenues. Options include PE teachers, fitness instructors, sports coaches, personal trainers and research and development. The sports performance industry is the most competitive to enter.
The Study of Sporting Injuries
10 May 2021
With over four million people being treated each year for sports-related injuries, it is clearly a problem and requires further study. Sports scientists need to look at ways to reduce injuries and, when they inevitably occur, and how to speed up the athlete's recovery time.